The Global Positioning System (GPS) relies on its primary L1 frequency to broadcast precise timing and orbital data, allowing receivers on Earth to calculate their exact location. Because the L1 C/A signal transmits at just fifty bits per second, every bit of this navigation data must earn its place. Yet, within this highly constrained signal, the standard sets aside Subframe 4, Page 17 – a 176-bit field broadcast every 12.5 minutes – for “special messages with the specific contents at the discretion of the Operating Command”. While the official specification suggests it carries readable text, the reality is entirely different. For nearly twenty years, this channel has acted as a global numbers station, broadcasting military ciphertext on a public signal to billions of receivers in plain sight.
Analysing a Nineteen-Year Archive
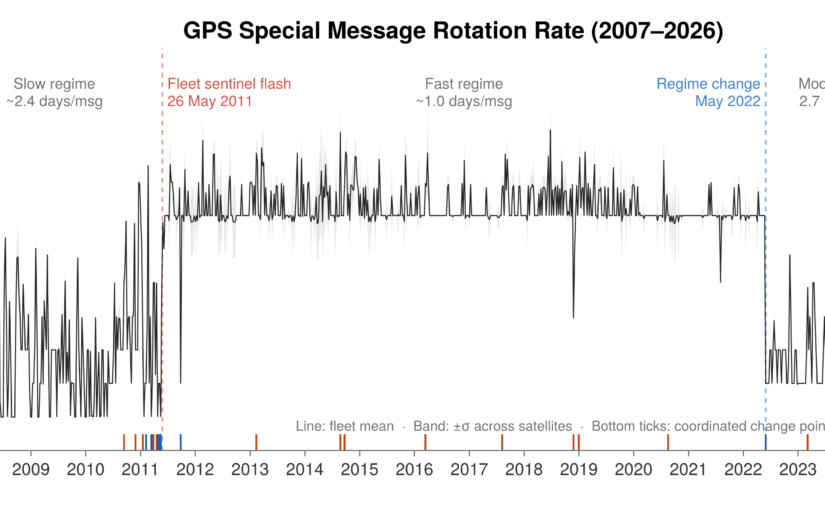
To understand what these broadcasts actually contain, we analysed an archive of 24.09 million observations collected between 2007 and early 2026. To make interactive processing of this dataset practical, we built a Julia pipeline to extract the bits directly into a DuckDB database. This setup allowed us to run queries across nineteen years of global ground-station data in milliseconds. The results are summarised below, and further details can be found in the May/June 2026 edition of Inside GNSS: The Empty Field That Wasn’t: GPS, OTAD and Two Decades of Encrypted Broadcasts.
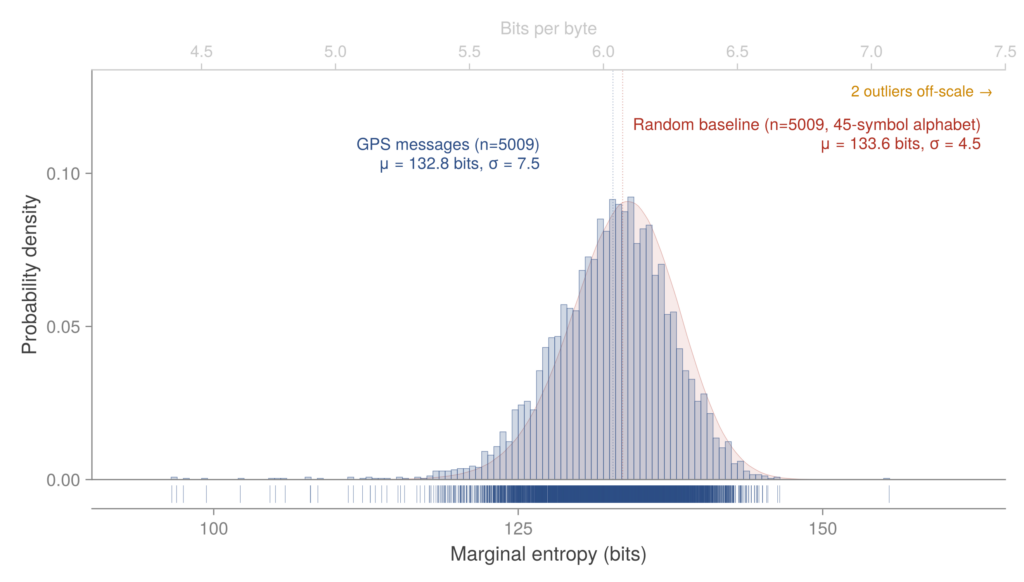
Our first question was basic: is this field carrying text in an unusual format, or is it true ciphertext?. We calculated the marginal entropy of the payloads using a compression model trained on our data. The results matched a synthetic baseline of random noise almost perfectly. By every statistical measure, the GPS messages are indistinguishable from random data, but we found a few clear, structural exceptions.
First, we found intentional placeholders. Satellites frequently broadcast 22 bytes of 0xAA (the CP437 negation glyph ‘¬’). In binary, 0xAA is 10101010 – a standard test pattern used in hardware to check connections and frame alignment. A satellite sending this pattern is effectively stating that no operational payload is loaded.
Continue reading The Quiet Numbers Station: Decoding Nineteen Years of GPS Cryptography
")