A Marlin is One of the Fastest SNARKs in the Ocean

In this post, we discuss our new zero-knowledge proving system, Marlin, by Chiesa, Hu, Maller, Mishra, Vesely, and Ward. This year has been the year of the universal SNARK, with Sonic, Libra, and Plonk all bidding for attention. Marlin is yet another competitor, one which we recommend using when you require fast verification time without the use of batching.

Why Universal SNARKs?

A universal SNARK is a proving system in which a single trusted setup suffices to prove anything that we know how to prove. That means that the same setup could be used across all applications and that parameters could be stored in a general-purpose library. Additionally, these universal SNARKs typically have relatively easy to coordinate setup procedures, which makes it easier to convince users that the procedure has been carried out correctly and securely.

Some SNARKs avoid setup procedures altogether. Such works include Spartan, Halo, and Hyrax. However, the cost of avoiding a trusted setup can generally be seen in the proof sizes and verification time.

Marlin or Sonic?

In this authors’ humble opinion, Sonic is fabulous. The proofs are small, the provers are fast, and the verification is fast provided one is verifying many proofs at the same time. For applications that use batched verifications, Sonic currently remains the state-of-the-art. Cryptocurrency transactions are a classic example of this – nodes can verify all the transactions in a new block simultaneously (provided the miner aggregates the transactions). However, this setting in which Sonic excels, i.e. the setting in which the verifier is not just given a single proof but many, many proofs of the same thing, is not always a given. For an example where Sonic’s batched proofs would not suffice, consider a randomness beacon. Here verification of the beacons outputs is only done once in a while. Therefore it would be a setting where batching is totally inappropriate.

Continue reading A Marlin is One of the Fastest SNARKs in the Ocean
Measuring mobility without violating privacy – a case study of the London Underground

In the run-up to this year’s Privacy Enhancing Technologies Symposium (PETS 2019), I noticed some decidedly non-privacy-enhancing behaviour. Transport for London (TfL) announced they will be tracking the wifi MAC addresses of devices being carried on London Underground stations. Before storing a MAC address it will be hashed with a key, but since this key will remain unchanged for an extended period (2 years), it will be possible to track the movements of an individual over this period through this pseudonymous ID. These traces are likely enough to link records back to the individual with some knowledge of that person’s distinctive travel plans. Also, for as long as the key is retained it would be trivial for TfL (or someone who stole the key) to convert the someone’s MAC address into its pseudonymised form and indisputably learn that that person’s movements.

TfL argues that under the General Data Protection Regulations (GDPR), they don’t need the consent of individuals they monitor because they are acting in the public interest. Indeed, others have pointed out the value to society of knowing how people typically move through underground stations. But the GDPR also requires that organisations minimise the amount of personal data they collect. Could the same goal be achieved if TfL irreversibly anonymised wifi MAC addresses rather than just pseudonymising them? For example, they could truncate the hashed MAC address so that many devices all have the same truncated anonymous ID. How would this affect the calculation of statistics of movement patterns within underground stations? I posed these questions in a presentation at the PETS 2019 rump session, and in this article, I’ll explain why a set of algorithms designed to violate people’s privacy can be applied to collect wifi mobility information while protecting passenger privacy.

It’s important to emphasise that TfL’s goal is not to track past Underground customers but to predict the behaviour of future passengers. Inferring past behaviours from the traces of wifi records may be one means to this end, but it is not the end in itself, and TfL creates legal risk for itself by holding this data. The inferences from this approach aren’t even going to be correct: wifi users are unlikely to be typical passengers and behaviour will change over time. TfL’s hope is the inferred profiles will be useful enough to inform business decisions. Privacy-preserving measurement techniques should be judged by the business value of the passenger models they create, not against how accurate they are at following individual passengers around underground stations in the past. As the saying goes, “all models are wrong, but some are useful”.

Simulating privacy-preserving mobility measurement

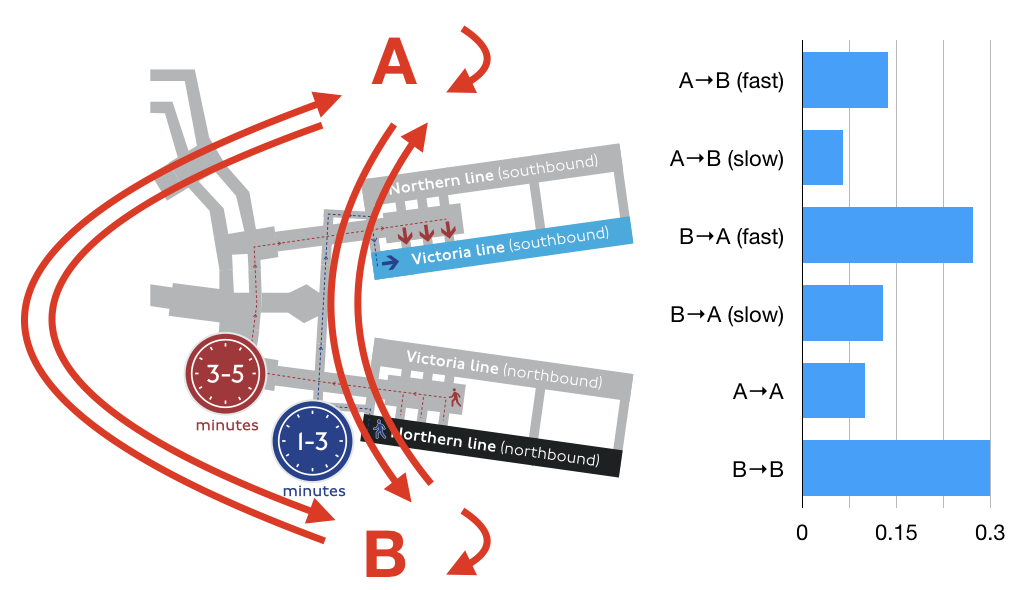
To explore this space, I built a simple simulation of Euston Station inspired by one of the TfL case studies. In my simulation, there are two platforms (A and B) and six types of passengers. Some travel from platform A to B; some from B to A; others enter and leave the station at one platform (A or B). Of the passengers that travel between platforms, they can take either the fast route (taking 2 minutes on average) or the slow route (taking 4 minutes on average). Passengers enter the station at a Poisson arrival rate averaging one per second. The probabilities that each new passenger is of a particular type are shown in the figure below. The goal of the simulation is to infer the number of passengers of each type from observations of wifi measurements taken at platforms A and B.

Continue reading Measuring mobility without violating privacy – a case study of the London Underground

A Reflection on the Waves Of Malice: Malicious File Distribution on the Web (part 2)

The first part of this article introduced the malicious file download dataset and the delivery network structure. This final part explores the types of files delivered, discusses how the network varies over time, and concludes with challenges for the research community.

The Great Divide: A PUP Ecosystem and a Malware Ecosystem

We found a notable divide in the delivery of PUP and malware. First, there is much more PUP than malware in the wild: we found PUP-to-malware ratios of 5:1 by number of SHA-2s, and 17:2 by number of raw downloads. Second, we found that mixed delivery mechanisms of PUP and malware are not uncommon (e.g., see our Opencandy case study in the paper). Third, the highly connected Giant Component is predominantly a PUP Ecosystem (8:1 PUP-to-malware by number of SHA-2s), while the many “islands” of download activity outside of this component are predominantly a Malware Ecosystem (1.78:1 malware-to-PUP by number of SHA-2s).

Comparing the structures of the two ecosystems,we found that the PUP Ecosystem leverages a higher degree of IP address and autonomous system (AS) usage per domain and per dropper than the Malware Ecosystem, possibly indicating higher CDN usage or the use of evasive fast-flux techniques to change IP addresses (though, given earlier results, the former is the more likely). On the other hand, the Malware Ecosystem was attributed with fewer SHA-2s being delivered per domain than the PUP Ecosystem with the overall numbers in raw downloads remaining the same, which could again be indicative of a disparity in the use of CDNs between the two ecosystems (i.e., CDNs typically deliver a wide range of content). At the same time, fewer suspicious SHA-2s being delivered per domain could also be attributable to evasive techniques being employed (e.g., malicious sites delivering a few types of files before changing domain) or distributors in this ecosystem dealing with fewer clients and smaller operations.

We tried to estimate the number of PPIs in the wild by defining a PPI service as a network-only component (or group of components aggregated by e2LD) that delivered more than one type of malware or PUP family. Using this heuristic, we estimated a lower bound of 394 PPIs operating on the day, 215 of which were in the PUP Ecosystem. In terms of proportions, we found that the largest, individual PPIs in the PUP and Malware Ecosystems involved about 99% and 24% of all e2LDs and IPs in their ecosystems, respectively.

With there being a number of possible explanations for these structural differences between ecosystems, and such a high degree of potential PPI usage in the wild (especially within the PUP Ecosystem), this is clearly an area in which further research is required.

Keeping Track of the Waves

The final part of the study involved tracking these infrastructures and their activities over time. Firstly, we generated tracking signatures of the network-only (server-side) and file-only (client-side) delivery infrastructures. In essence, this involved tracking the root and trunk nodes in a component, which typically had the highest node degrees, and thus, were more likely to be stable, as opposed to the leaf nodes, which were more likely to be ephemeral.

Continue reading A Reflection on the Waves Of Malice: Malicious File Distribution on the Web (part 2)

A Reflection on the Waves Of Malice: Malicious File Distribution on the Web (part 1)

The French cybercrime unit, C3N, along with the FBI and Avast, recently took down the Retadup botnet that infected more than 850,000 computers, mostly in South America. Though this takedown operation was successful, the botnet was created as early as 2016, with the operators reportedly making millions of euros since. It is clear that large-scale analysis, monitoring, and detection of malicious downloads and botnet activity, even as far back as 2016, is still highly relevant today in the ongoing battle against increasingly sophisticated cybercriminals.

Malware delivery has undergone an impressive evolution since its inception in the 1980s, moving from being an amateur endeavor to a well-oiled criminal business. Delivery methods have evolved from the human-centric transfer of physical media (e.g., floppy disks), sending of malicious emails, and social engineering, to the automated delivery mechanisms of drive-by downloads (malicious code execution on websites and web advertisements), packaged exploit kits (software packages that fingerprint user browsers for specific exploits to maximise the coverage of potential victims), and pay-per-install (PPI) schemes (botnets that are rented out to other cybercriminals).

Furthermore, in recent times, researchers have uncovered the parallel economy of potentially unwanted programs (PUP), which share many traits with the malware ecosystem (such as their delivery through social engineering and PPI networks), while being primarily controlled by different actors. However with some types of PUP, including adware and spyware, PUP has generally been regarded as an annoyance rather than a direct threat to security.

Using the download metadata of millions of users worldwide from 2015/16, we (Colin C. Ife, Yun Shen, Steven J. Murdoch, Gianluca Stringhini) carried out a comprehensive measurement study in the short-term (a 24-hour period), the medium-term (daily, over the course of a month), and the long-term (weekly, over the course of a year) to characterise the structure of this complex malicious file delivery ecosystem on the Web, and how it evolves over time. This work provides us with answers to some key questions, while, at the same time, posing some more and exemplifying some significant issues that continue to hinder security research on unwanted software activity.

An Overview

There were three main research questions that influenced this study, which we will traverse in the following sections of this post:

    1. What does the malicious file delivery ecosystem look like?
    2. How do the networks that deliver only malware, only PUP, or both compare in structure?
    3. How do these file delivery infrastructures and their activities change over time?

For full technical details, you can refer to our paper – Waves of Malice: A Longitudinal Measurement of the Malicious File Delivery Ecosystem on the Web – published by and presented at the ACM AsiaCCS 2019 conference.

The Data

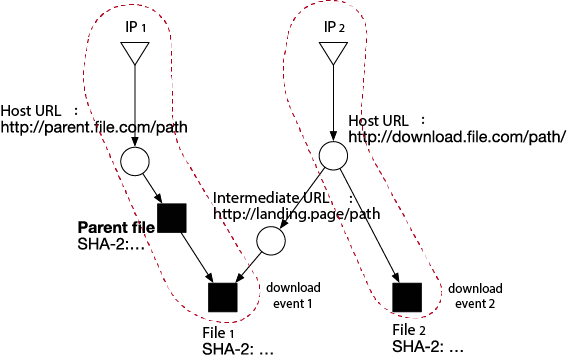
The dataset was provided (and pre-sanitized) by Symantec and consisted of 129 million download events generated by 12 million users. Each download event contained information such as the timestamp, the SHA-2s of the downloaded file and its parent file, the filename, the size (in bytes), the referrer URL, Host URLs (landing pages after redirection) of the download and parent file, and the IP address hosting the download.

Continue reading A Reflection on the Waves Of Malice: Malicious File Distribution on the Web (part 1)