The French cybercrime unit, C3N, along with the FBI and Avast, recently took down the Retadup botnet that infected more than 850,000 computers, mostly in South America. Though this takedown operation was successful, the botnet was created as early as 2016, with the operators reportedly making millions of euros since. It is clear that large-scale analysis, monitoring, and detection of malicious downloads and botnet activity, even as far back as 2016, is still highly relevant today in the ongoing battle against increasingly sophisticated cybercriminals.
Malware delivery has undergone an impressive evolution since its inception in the 1980s, moving from being an amateur endeavor to a well-oiled criminal business. Delivery methods have evolved from the human-centric transfer of physical media (e.g., floppy disks), sending of malicious emails, and social engineering, to the automated delivery mechanisms of drive-by downloads (malicious code execution on websites and web advertisements), packaged exploit kits (software packages that fingerprint user browsers for specific exploits to maximise the coverage of potential victims), and pay-per-install (PPI) schemes (botnets that are rented out to other cybercriminals).
Furthermore, in recent times, researchers have uncovered the parallel economy of potentially unwanted programs (PUP), which share many traits with the malware ecosystem (such as their delivery through social engineering and PPI networks), while being primarily controlled by different actors. However with some types of PUP, including adware and spyware, PUP has generally been regarded as an annoyance rather than a direct threat to security.
Using the download metadata of millions of users worldwide from 2015/16, we (Colin C. Ife, Yun Shen, Steven J. Murdoch, Gianluca Stringhini) carried out a comprehensive measurement study in the short-term (a 24-hour period), the medium-term (daily, over the course of a month), and the long-term (weekly, over the course of a year) to characterise the structure of this complex malicious file delivery ecosystem on the Web, and how it evolves over time. This work provides us with answers to some key questions, while, at the same time, posing some more and exemplifying some significant issues that continue to hinder security research on unwanted software activity.
An Overview
There were three main research questions that influenced this study, which we will traverse in the following sections of this post:
-
- What does the malicious file delivery ecosystem look like?
- How do the networks that deliver only malware, only PUP, or both compare in structure?
- How do these file delivery infrastructures and their activities change over time?
For full technical details, you can refer to our paper – Waves of Malice: A Longitudinal Measurement of the Malicious File Delivery Ecosystem on the Web – published by and presented at the ACM AsiaCCS 2019 conference.
The Data
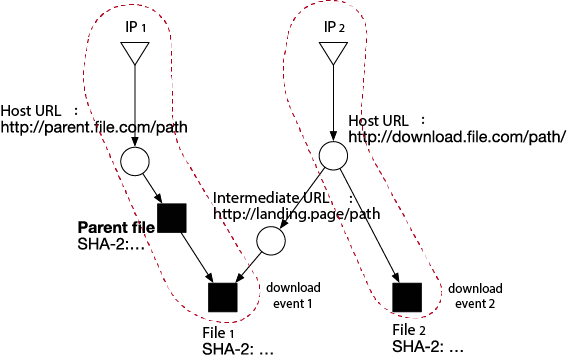
The dataset was provided (and pre-sanitized) by Symantec and consisted of 129 million download events generated by 12 million users. Each download event contained information such as the timestamp, the SHA-2s of the downloaded file and its parent file, the filename, the size (in bytes), the referrer URL, Host URLs (landing pages after redirection) of the download and parent file, and the IP address hosting the download.
The data was sampled over the course of a year (Figure 1). We then used a graph analysis approach to characterize the structural relationships between downloaded files and their providers (dropper files, host URLs, and IP addresses – see example in Figure 2).

General Statistics
Here are the overall statistics relating to the snapshot and longitudinal analyses:
Snapshot analysis: Graph of 1.6M nodes and 1.9M edges consisting of 965K unique files (SHA-2s), 603K URLs (131K fully qualified domain names), and 92K IP addresses. These are generated from 1.6M download events on 1 October 2015.
Longitudinal analysis: In total, there are 21.3M unique files, 12.4M unique URLs, and 553K unique IP addresses in the dataset, which are generated from 129M download events. We generated 78 graph snapshots corresponding to the sampled period between October 2015 and September 2016.
A Giant, Giant Component
Our first key finding was the presence of a massive delivery infrastructure, which corresponded to the Giant Component (GC) – the largest connected component in any graph. However, the GC was inordinately larger than any other component in this graph. In raw numbers, this Giant Component comprised of 1.3M nodes and 1.6M edges and accounted for over 80% of suspicious downloads. There were 58K other connected components of isolated download activities (the non-Giant Component subgraph, or NGC), with the next largest consisting of only 2K nodes. In real terms, this GC either represented one massive delivery operation or a well-connected marketplace of infrastructure providers. Given prior research on the cybercriminal economy and the illegal services that are traded between them, the latter is the more likely explanation. Either way, as the data suggests, we can confidently rule out malware delivery mostly being a set of vertically integrated operations, i.e., actors carrying out the entire process of malware delivery (from malware development all the way to monetizing victim computers and stolen information) by themselves.
We conducted several graph percolation experiments to test the robustness of this structure by sequentially removing its most influential nodes until it completely disintegrates. In essence, we found that multiple types of nodes contributed significantly to the connectivity of the GC: totally removing IP addresses accounted for a 31% loss in size, while completely removing all server-side nodes (URLs, IPs) left a file-only structure 20% the size of the original GC, but still 90 times larger than the next largest component (2K nodes) in the overall graph. We also found that the GC was stable, persisting over the course of the entire year.
Finally, we found that within these “most influential” nodes of the GC structure, over two-thirds of the IP nodes were based in the United States, while many of the top effective second-level domains (e2LDs) were well-known, benign CDNs and cloud service providers, including MediaFire, Windows Azure, Softonic, and Google. From an action point of view, these could be pointers to where Internet service provider (ISP) takedowns or increased security hygiene pressure should be focused to disrupt the global suspicious file delivery ecosystem most effectively.
Continue to the second part of this article →